 MyAPEEE
Transport 2025 Survey Results
The results from the Transport surveys from June 2025 are out!
A huge thank you to all the parents and students who took the time to answer.
As the survey was designed to be comprehensive, we present here a brief overview of the results and some of the key points the Transport service will focus on moving forward. For legibility purposes, any percentages mentioned are rounded to the nearest round number in the text below, but the specific stats can be found in the documents linked below.
Parents’ Survey
This survey was addressed to all parent members of the APEEE Ixelles in 24/25. 347 parents answered the survey (with an 82% completion rate). Assuming each parent represents a different family and based on the answers from the survey on the number of children of our respondents, this means that this survey was able to gather the responses for approximately 19% of the EEB3 population.
Representation
Responses by language section appear to be a close representation of the student population.
Responses by school year are less representative of the EEB3 population, as the S4-S7 years were significantly under-represented (27% of responses for 40% of the EEB3 population) which may be explained by the existence of the survey aimed directly at those students.
Responses by Transport enrolment are, as expected, over-representing the families enrolled to the Transport service.
Transport Use Variability
Most respondents use the same transportation method throughout the year. Similarly, most families who answered the survey only use one home address.
Special Needs in Transportation
Of the 335 answers regarding special needs requiring accommodation during transportation, 2% of respondents mentioned the need for accommodation.
Due to the discrepancy in answers between the number of children requiring accommodation due to special needs (12) and the number of answers about satisfaction about these accommodations (126), we were unable to estimate the level of satisfaction on this topic.
Transport Users
12% of respondents were new Transport users in 24/25, and the overall clarity of information was positive, though some improvements can still be made. The newly updated Transport Service's Frequently-Asked-Questions aims to provide more clarity for our users.
Bus Journey

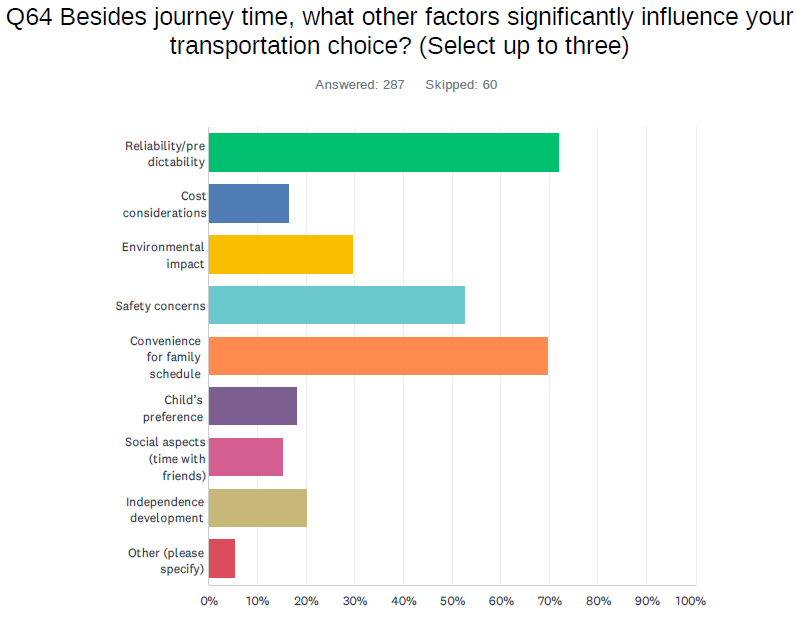
On average, based on families’ estimations, travel by bus would take approximately the same time as by car, while public transport and walking or cycling to school would, on average, take more time. As journey time is considered an important factor by most respondents using the Transport service, this is something that our service can be proud of.
Additional factors that the Transport service should focus on, based on our survey, are reliability/predictability, family schedule convenience, and safety concerns, followed by environmental concerns.
Transport Satisfaction
Overall satisfaction with our Transport service is positive, with driver behaviour, vehicle comfort, and safety measures eliciting the strongest positive answers.
Monitor supervision and communication about changes appear to be where we should focus our efforts to improve, although the overall satisfaction for these elements remains positive.
Bus Driver & Bus Monitor
Overall, respondents were satisfied with their driver’s attitude although it is noted that the question did not allow for the different drivers for each bus line. Respondents were overwhelmingly satisfied with the driving and comfort in the bus.
Bus monitors, although still overall positive, received more mixed responses, which will be taken into consideration.
Transport Office & Communication
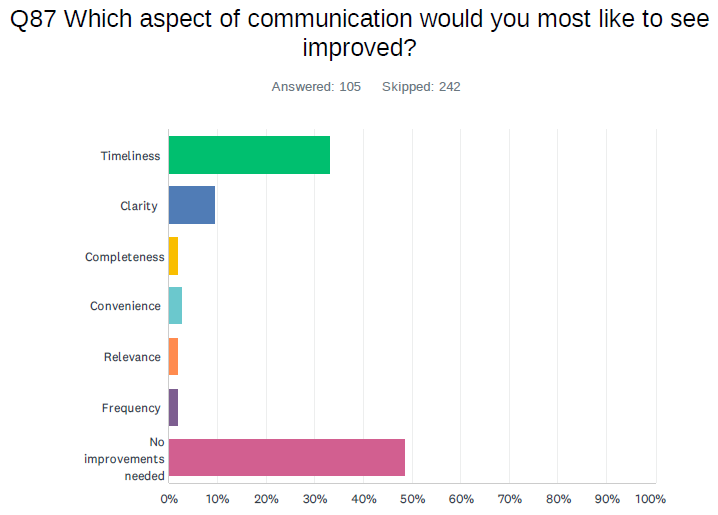
Communication from the Transport Office is deemed satisfactory by most Transport users in our survey.
Timeliness of communication is the main aspect that respondents would most like to see improved, and we hope the introduction of the new tracking system for this school year has helped solve some of these issues.
Safety and Incidents in the Bus
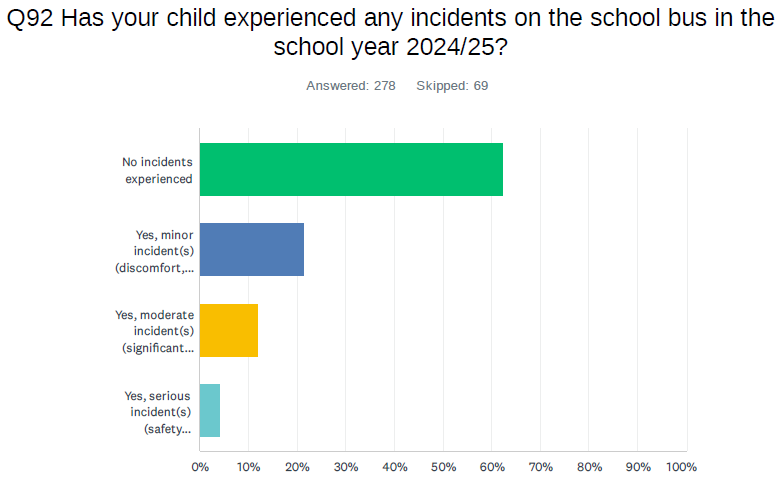
Overall, while 41% of respondents have no specific safety concerns, safety should of course continue to be a priority in managing the Transport service. Only 4% of parents reported serious incidents in the survey. It is worth noting that the incidents reported to the Transport Office were, according to the survey respondents, handled in a short period of time and resolved in a satisfactory manner.
Bus Tracking
These questions helped guide us in the selection of a bus tracking system that would suit users of the Transport service as best as possible.
A high demand for real-time location, mostly on smartphones, with expected use once or more per day for most respondents was the overall result of these questions. The main concerns noted were on the topic of data security, privacy concerns, and technical reliability.
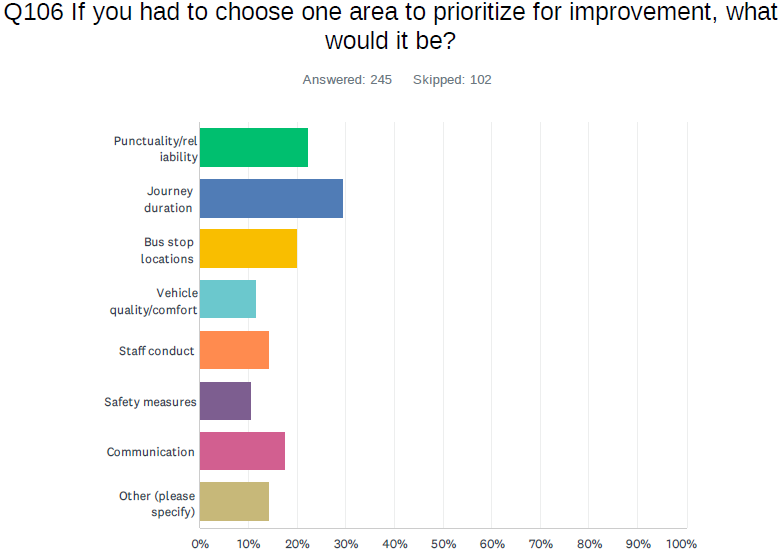
Additional Improvements
Overall, most questions in this section underline that the Transport service is providing a satisfactory service to most respondents, which is something the APEEE can pride itself on.
As we continuously strive for improvement, the following topics have been noted as focus points: journey time, communication timeliness, and more visual explanations (with a strong assumption on the use of maps for bus stops and routes).
Students’ Survey (S4-S7)
This survey was addressed to all S4 to S7 students of EEB3, and out of the 1314 students enrolled in 24/25, 135 students answered the survey (with a 64% completion rate). This means that approximately 10% of students answered the survey, which is very low. It may also be worth noting that a small portion of the respondents, based on their answers in the open-ended questions, were either parents or not answering seriously.
Representation
Language sections and school year were not included as questions in this survey.
Responses by Transport enrolment are, as expected, over-representing the students enrolled to the Transport service.
Transport Use Variability
About 30% of students don’t use the bus every day, generally due to external activities or Wednesday classes in the afternoon.
Bus Journey
Overall, the different elements we asked respondents to rate were positive, with a note for the noise level on the bus which was rated less positively than the rest.
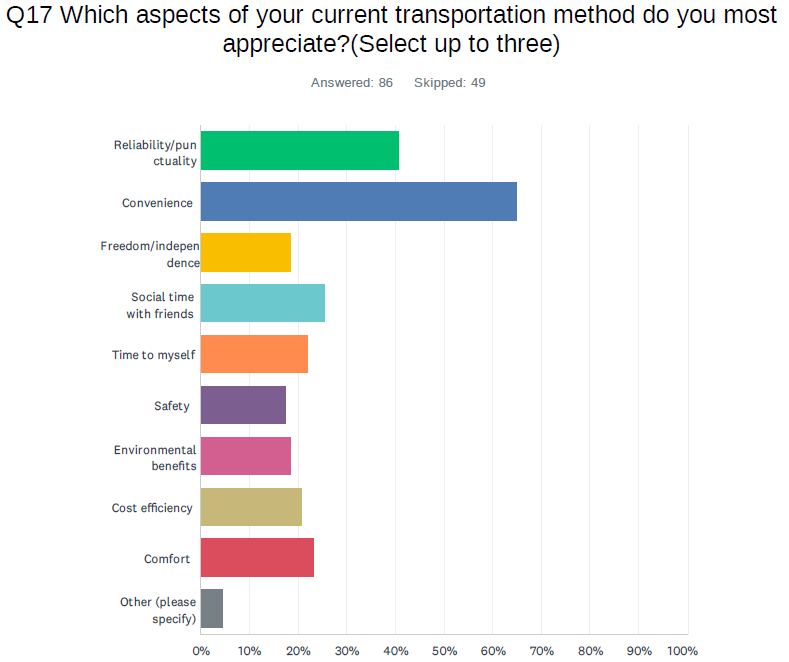
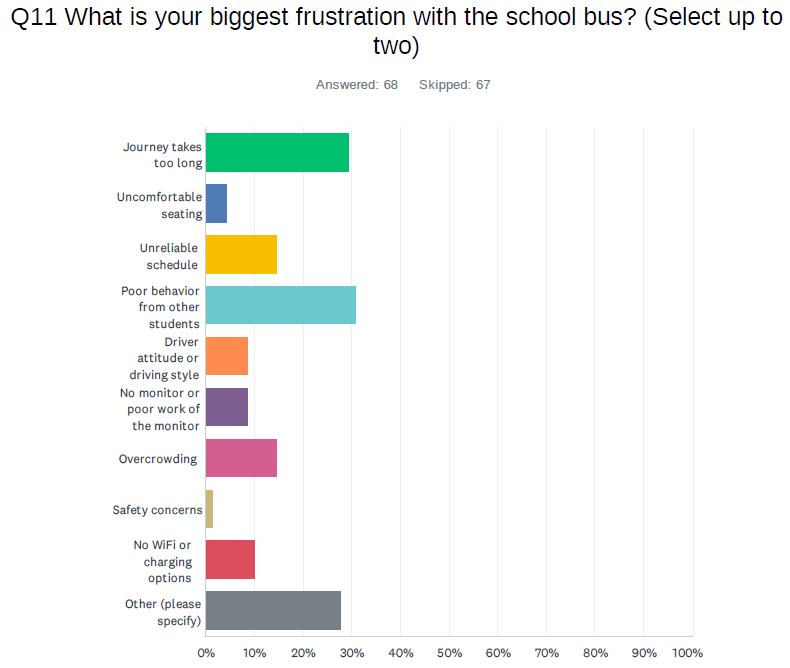
Travel time and student behaviour were noted as the most relevant frustrations while on the bus, while convenience and reliability/punctuality were the most appreciated traits of the Transport service.
Bus Tracking
The response for a bus tracking app was largely positive. Currently, students mainly depend on their parents for information on their bus progress.
Improvements
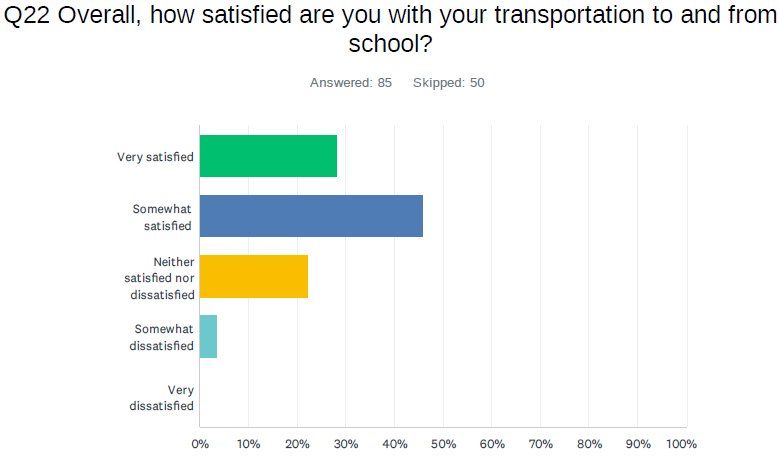
Based on this survey, the overall satisfaction level of the Transport service for our S4-S7 students was positive.
Following the responses, we can however focus on a few elements for improvement: more direct communication with students about their bus progress and managing noise level and student behaviour.
Conclusion
While we are aware that we received a low number of responses compared to the overall school population, a few points can still be extracted from these surveys.
The main points that have been requested for improvement are journey time, communication timeliness, bus monitoring (with an emphasis on student behaviour and noise level), and more visual communication. The introduction of the new bus tracking system should have helped with communication, and journey time and bus monitoring are regularly reviewed by the Transport Office as they are key features of our service.
Overall, the APEEE Transport service was perceived as satisfactory by most respondents, and we will continue our work to keep this positive perception of our service.
The documents below present the raw data from the surveys.
Please note that:
- The responses to open questions were removed as some contained personal information
- Some questions have less respondents as they were asked to only a subset of respondents (Transport service users, respondents who experienced an incident, etc)
- In the Parents' Survey, questions 27-34 (pp3-10), 35-42 (pp11-18), 43-49 (pp19-26), and 50-56 (pp 27-33) are repeated to allow parents to answer for each individual child. These were combined for the overview presented above.